Are you drowning in data and looking for a lifeline? Enter Pandas, the Swiss Army knife of data manipulation in Python. Whether you’re a budding data scientist or a curious programmer, this guide will walk you through a real-world project, showing you how to wrangle data like a seasoned pro.
Why Pandas? The Data Scientist’s Best Friend
Before we dive in, let’s address the elephant in the room: Why Pandas? Well, imagine trying to organize a library with thousands of books using just your hands. Now, picture having a magical assistant that can sort, filter, and analyze those books in seconds. That’s Pandas for your data.
- Pandas simplifies complex data operations
- It’s fast, efficient, and plays well with other Python libraries
- The learning curve is gentler than you might think
Getting Started: Our ESPN Data Adventure
For this tutorial, we’ll be working with data scraped from ESPN. It’s messy, it’s real, and it’s exactly the kind of data you’ll encounter in the wild. Let’s roll up our sleeves and get our hands dirty (digitally, of course).
You may find the step-by-step video tutorial about this project on ▶️ YouTube.
Setting Up Your Pandas Playground
First things first, let’s import Pandas and load our data:
| import pandas as pd df = pd.read_excel(‘espn.xlsx’) df |
This simple code snippet is your first step into the world of Pandas. We’re importing the library and reading an Excel file. Easy, right?
Renaming Columns: Clarity is Key
Ever tried to decipher cryptic column names? Let’s make our data more human-friendly:
| df1 = df.rename(columns={‘NO’: ‘Not_Outs’, ‘HS’: ‘Highest_Inns_Score’, ‘BF’: ‘Balls_Faced’, ‘SR’: ‘Strike_rate’}) df1 |
Pro tip: Clear column names make your data more accessible and reduce the chances of misinterpretation. It’s like labeling your spice rack – you wouldn’t want to mix up salt and sugar!
Hunting for Null Values: The Data Detective’s First Move
Missing data can throw a wrench in your analysis. Let’s see if we have any gaps:
| df1.isnull().any() |
This line checks for null values in each column. It’s like doing a roll call for your data – who’s present, and who’s playing hooky?
For a deeper dive into handling missing data, check out W3Schools’ guide on cleaning empty cells.
Zooming In on the Missing Pieces
Want to see exactly where those nulls are hiding? Try this:
| df1[df1[‘Balls_Faced’].isna() == 1] |
This code snippet shows us rows where ‘Balls_Faced’ is null. It’s like using a magnifying glass to spot the holes in your data fabric.
Dealing with Duplicates: Keeping Your Data Unique
In the world of data, duplicates are like uninvited guests at a party. They take up space and can skew your analysis. Let’s learn how to spot and remove them.
Spotting the Copycats
| df1.duplicated() |
This simple line checks for duplicate rows across all columns. But what if we want to check for duplicates in a specific column?
| df1[df1[‘Player’].duplicated() == 1] |
This shows us duplicate players. It’s like finding out you’ve accidentally invited the same person to your party twice!
Showing Duplicates the Door
| df2 = df1.drop_duplicates() df2 |
With this line, we’ve created a new dataframe df2 without any duplicates. It’s like politely asking those extra guests to leave, ensuring each data point is unique and valuable.
Splitting Columns: Divide and Conquer
Sometimes, one column contains multiple pieces of information. Let’s see how to split these up for more granular analysis.
Breaking Apart the ‘Span’ Column
| df2[‘Starting Year’] = df2[‘Span’].str.split(‘-‘).str[0] df2[‘Final Year’] = df2[‘Span’].str.split(‘-‘).str[1] |
We’ve just turned one column into two, separating the start and end years. It’s like unpacking a suitcase – now everything’s laid out where we can see it clearly.
Cleaning Up: Removing the Original ‘Span’ Column
| df3 = df2.drop([‘Span’], axis=1) |
Now that we’ve extracted the information we need, we can remove the original ‘Span’ column. It’s like recycling the suitcase once we’ve unpacked everything.
Extracting Player Names and Countries
Our ‘Player’ column contains both names and countries. Let’s separate them:
| x = df3[‘Player’].str.split(‘(‘) df3[‘Player’] = x.str[0] df3[‘Country’] = x.str[1].str.split(‘)’).str[0] |
This code is like a skilled surgeon, precisely separating intertwined data. We now have clean, separate columns for player names and countries.
Changing Data Types: The Right Tool for the Job
Just as you wouldn’t use a hammer to paint a wall, using the wrong data type can make your analysis clumsy. Let’s fix that:
| df3[‘Highest_Inns_Score’] = df3[‘Highest_Inns_Score’].str.split(‘*’).str[0].astype(‘int’) df4 = df3.astype({‘Starting Year’:’int’, ‘Final Year’: ‘int’}) |
We’ve removed the ‘*’ from ‘Highest_Inns_Score’ and converted several columns to integers. It’s like translating everything into a common language so our data can communicate effectively.
For more on grouping and aggregating data, which we’ll do next, check out this comprehensive guide on Pandas GroupBy.
Analysis Time: Answering Real Questions
Now that our data is clean, let’s put it to work!
Average Career Length
| average_career = df5[‘career_length’].mean() print(f”The average career length is {average_career:.2f} years”) |
Strike Rates for Long Careers
| long_career_strike_rate = df5[df5[‘career_length’] > 10][‘Strike_rate’].mean() print(f”The average strike rate for players with careers over 10 years is {long_career_strike_rate:.2f}”) |
Pre-1960 Players
| early_players = df5[df5[‘Starting Year’] < 1960][‘Player’].count() print(f”Number of players who started their career before 1960: {early_players}”) |
Highest Individual Scores by Country
| high_scores = df5.groupby(‘Country’)[‘Highest_Inns_Score’].max().sort_values(ascending=False) print(“Top 5 countries by highest individual score:”) print(high_scores.head()) |
These analyses transform our raw data into insights. It’s like turning a pile of ingredients into a gourmet meal!
❓ Frequently Asked Questions (FAQs)
1. What is Pandas and why should I learn it?
Pandas is a powerful Python library for data manipulation and analysis. It’s essential for anyone working with data because:
- It simplifies complex data operations
- It’s fast and efficient, especially for large datasets
- It integrates well with other Python libraries for data science and machine learning
2. Do I need to be an expert in Python to use Pandas?
No, you don’t need to be a Python expert. Basic Python knowledge is helpful, but Pandas has a relatively gentle learning curve. This tutorial is designed for beginners and will guide you through the process step-by-step.
3. What kind of data can I work with using Pandas?
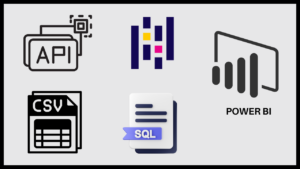
Pandas can handle various data formats, including:
- CSV and TSV files
- Excel spreadsheets
- SQL databases
- JSON files
- HTML tables
In this project, we use data from an Excel file, but the techniques can be applied to other formats as well.
4. How does Pandas handle missing data?
Pandas provides several methods to deal with missing data:
- Detecting missing values using isnull() or isna()
- Dropping rows or columns with missing data using dropna()
- Filling missing values with a specific value or method using fillna()
This project demonstrates how to identify and handle missing data effectively.
5. Can I use Pandas for data visualization?
While Pandas has some basic plotting capabilities, it’s often used in conjunction with other libraries like Matplotlib or Seaborn for more advanced visualizations. This project focuses on data cleaning and analysis, but you can easily extend it to include visualizations.
6. How can I practice more after completing this tutorial?
After this tutorial, you can:
- Work on your own datasets or find public datasets online
- Participate in data cleaning challenges on platforms like Kaggle
- Explore more advanced Pandas features like pivot tables and time series analysis
- Combine Pandas with other data science libraries like NumPy and Scikit-learn
7. Is Pandas suitable for big data?
Pandas works well for datasets that fit into memory. For very large datasets (big data), you might need to use other tools like Dask or PySpark, which offer Pandas-like interfaces for distributed computing.
8. How often is Pandas updated, and how can I stay current?
Pandas is actively maintained and regularly updated. To stay current:
- Follow the official Pandas documentation
- Join Python and data science communities on platforms like Reddit or Stack Overflow
- Attend data science meetups or conferences
- Subscribe to data science newsletters or blogs
Remember, the fundamentals you learn in this tutorial will remain relevant even as Pandas evolves!


